Wednesday, 15 April 2020

vSphere 7 Coredump

vSphere 7 Coredump


I'm just tidying up my vSphere 7 upgraded Host. Found a few things like the following to clean up:

  • Format Datastores with VMFS 6
  • Upgrade virtual hardware of VMs to version 17
  • Fix Coredump error (detailed below)
  • Move Scratch Partition to allow original Datastore to be formatted
  • Upgrade Distributed vSwitch version
To fix the Coredump problem when I formatted my Datastores I ran the following commands:
This is from the following KB:

I've converted my VMs to Thin but am seeing that UNMAP is unsupported on one of my Datastores in the vmkernel.log. not sure if this applies to all my SSD drives or what, is it due to the H240 controller? I checked a few commands and there's a lot of "unsupported" listed so may be manual or not work. At least by formatting and moving things around it's free'd up a lot of space and I've cleaned down a lot of old VMs from previous labs hanging around. IF I find any way forward on the UNMAP I'll post it here. 

Friday, 10 April 2020

vSphere 7 Ate my HBA

vSphere 7 Ate my HBA


My whitebox uses a Supermicro Motherboard that has an Intel c612 chipset for it's SATA controllers. I was using these up to the upgrade for 7.0 without issue and an LSI MegaRaid 9271-8i before that. As I stated in my last Post, I upgraded vCenter fine but during the upgrade for ESXi 7.0 got a warning about PCI device compatibility. My storage all disappeared, so I searched for a HBA on eBay to give me the cheapest solution. This turned up anHPE H240 SATA/SAS Controller. I connected everything up and after ESXi Booted, still no Datastores....!!!

CRAP!!!!

Sometimes the HBA goes into RAID mode by default though. Normally on a HPE server you press F9 to get into the System BIOS and then the HBA bios can be accessed from there. I didn't see any such option on boot with the Supermicro. There are CLI VIBs for ESXi 6.7 available but another option is to use an Offline SSA (Smart Storage Administrator). I tried the one below:
https://support.hpe.com/hpsc/swd/public/detail?swItemId=MTX_321a88714bff4279abf175b9bd
This version is dated Dec 2019 - I injected this ISO into the boot loader and waited to see what happened.....
Sure enough it was in RAID mode and my SSDs are not in a RAID set so I changed to HBA mode and rebooted. Note: I boot ESXi off USB and that was unaffected, thankfully!!
This is what ESXi saw after this change:

Looks good, only I have 4 x SSDs and all 4 were viewable in the SSA tool, so what happened the fourth SSD drive in ESXi?!! Getting closer though! I've also a Firmware update to apply so I'll install that and reboot and see what I can find out....
https://support.hpe.com/hpsc/swd/public/detail?swItemId=MTX_f20b99606f3f43f2b410a6d688
Extracted Zip and copied contents to my lab host and ran the following commands:
Now on reboot I'll load the SSA tool again and check my Motherboard Bios just to verify I can see all 4 x SSDs and identify which one is giving the problem.
Now in vCenter I can SEE it but it's not consumed.
I can format it now in vCenter, I wonder what was wrong with it?
That worked - use same name and all the ISO/Patch files on this Datastore were recovered and came back to life!!! Sorted!

Now, onto Discovering vSphere 7....!!


Friday, 3 April 2020

vSphere 7 ESXi Upgrade

vSphere 7 ESXi Upgrade


After upgrading vCenter, I now had to upgrade my single ESXi Lab host. I mounted the ISO using the BMC out of band utility and booted off the ISO. I ran into an issue with an NSX VIB however and it blocked the upgrade:

Alright, rebooted into ESXi 6.7 and put the host into maintenance mode to remove the offending VIB as follows:

esxcli software vib list

Now spot your offending VIB in the list - mine has the word nsx in it. Then remove it.

esxcli software vib remove -n esx-nsxv

Removal Result
   Message: Operation finished successfully.
   Reboot Required: false
   VIBs Installed:
   VIBs Removed: VMware_bootbank_esx-nsxv_6.7.0-0.0.8590012
   VIBs Skipped:

Ok, back to the upgrade.......

Crap, what's this about?!!! I'd better have all my network cards and Storage Devices after this install?!! 

Ok, so the install went ok, I have all my network cards BUT my LSI RAID Controller with all my SSD storage is not recognized!! Darn! Collaterol Damage! Where's that HCL?! 

So I've a Supermicro X10DRi-T-O and LSI MegaRaid 9271-8i. Neither storage chipset is recognized. Hopefully someone will release a hack but I might have to downgrade here if google doesn't turn up something......darn it!!! Best of luck with your upgrade, check the HCL's!! 


vCenter 7 Lab Upgrade

vCenter 7 Lab Upgrade


So I downloaded the binaries for vSphere 7 to upgrade my lab and see what's different. The release notes are scary this time to say the least!! The upgrade for vCenter is my first task and here is my notes from that experience:
  1. Attempt failed - Duplicate temporary IP Address, my bad! 
  2. Attempt failed - Timeout, too much time had expired?! This was when I clicked into the wizard and the precheck came back as failed! Ok, was doing something else, next time I'll babysit!
  3. Just got a blanket error this time. So am going to reboot vCenter and apply 1 March 2020 patch just in case and start all over again! 
  4. Time, Time, Time - it's all about the Time - get your NTP / VCSA and AD DC time all sync'd up to fix this problem!! 


This is from the upgrade-requirements.log:
2020-04-03T10:37:11.526Z ERROR __main__ ERROR: Fatal error during upgrade REQUIREMENTS. For more details take a look at: /var/log/vmware/upgrade/requirements-upgrade-runner.log
The release notes reference:
/var/log/vmware/upgrade/UpgradeRunner.log

I reboot the 6.7 vCenter appliance as part of the patch and found the time was out - fixed that using an NTP server and hoped this would help! It was out of sync by 2 hours despite saying HOST which was ok! 

Getting closer, this time I got:
Now, I found my Domain Controller out of Sync! Got all that fixed and made sure the vCenter 6.7 appliance could resolve the NTP IP of the DC ok and without errors and all the time looked ok. Just left with a few warnings:


The basic migration was 1.85 GB and 33 minutes, leaving Events and Historical Data out of it. Good time for a break!! 

Now I can finally log in!!!

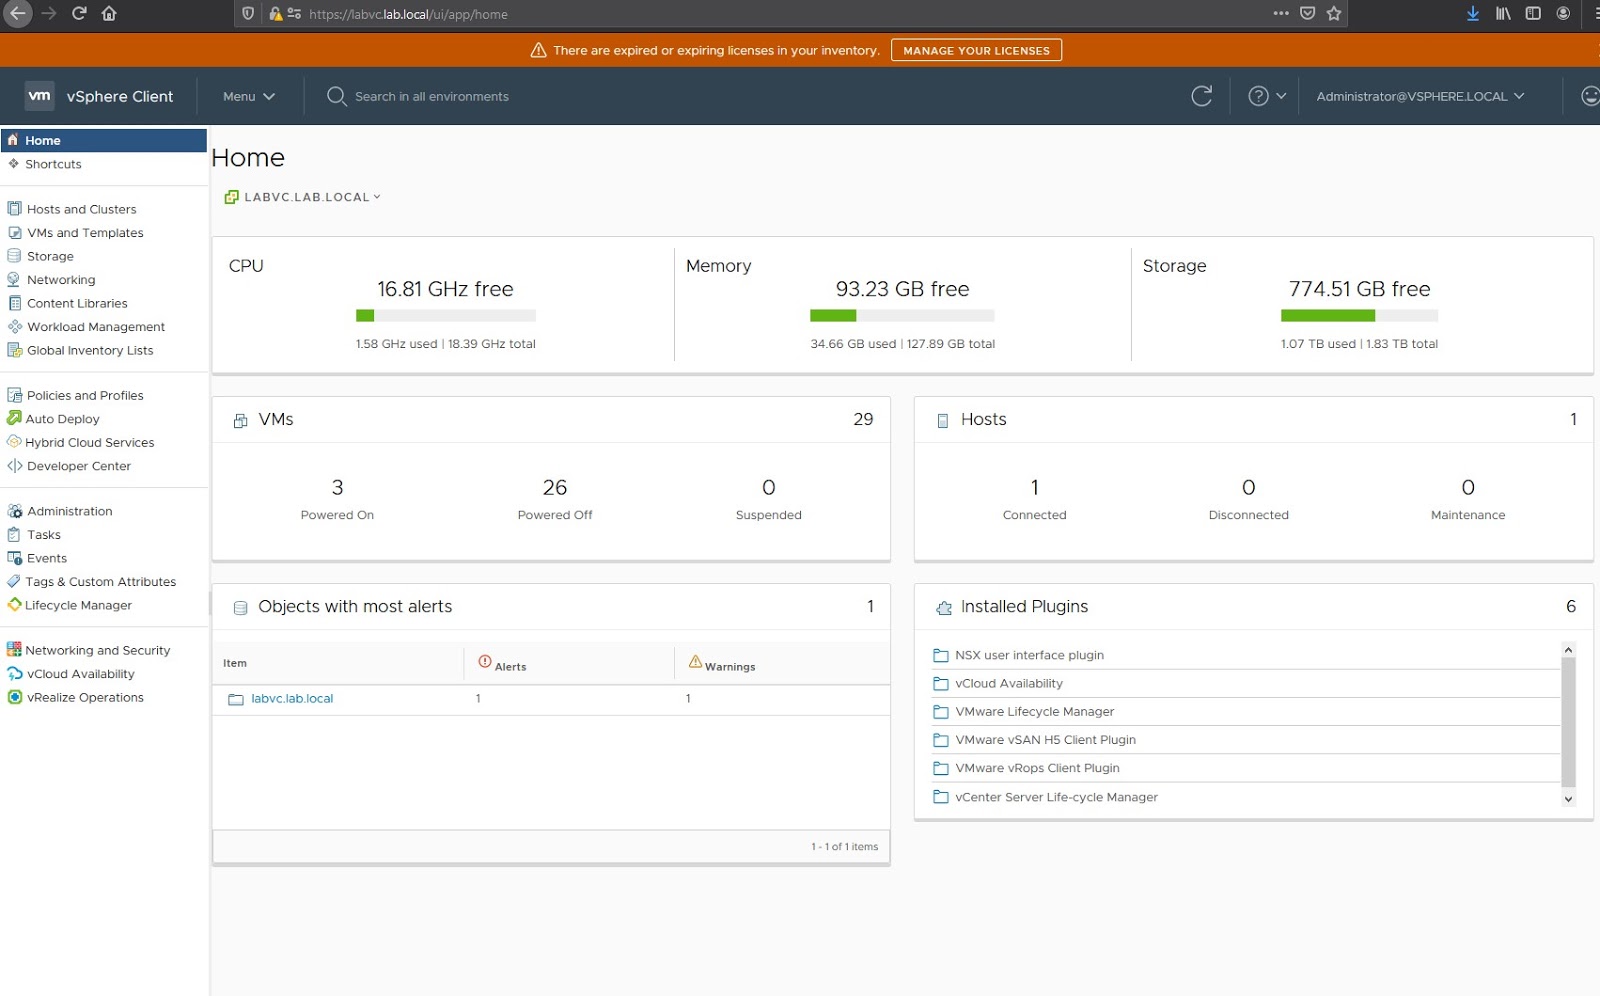
This is the new Home Page:
Now for the big question - is there STILL a Flex client:
NOOOOOOO!!!!! Haha!! All gone bye-byes!!! 

Now, all I need is to figure out how to upgrade my single host lab without update manager!! 


Wednesday, 5 February 2020

Powershell to clear allowed IP list and allow all IPs

Powershell to clear allowed IP list and allow all IPs


I found a few posts on setting specific IPs that are allowed through the ESXi Firewall for services such as SSH and Web Access for instance. What I lacked was a way to manipulate those when I realized I'd made a typo. I had inconsistent settings starting to develop and I wanted to script a way to reset to a blank page again!

The script below achieves that. I've also come up with an audit script to verify any rogue servers that have different settings from the default for two services sshServer and webAccess, the ones I was interested in. With lockdown mode it's probably a bit overkill but we get admins leaving things in an unconfigured way and having some extra insurance was desired.

If you have 80-100 hosts, this can save a lot of time picking through the gui!

This script removes the two subnets and returns the firewall to allow all IPs:

$Services = "webAccess","sshServer"
$remoteIP1 = "192.168.1.0/24"
$remoteIP2 = "10.1.1.0/24"
foreach($esx in Get-VMHost){
    $esxcli = Get-EsxCli -VMHost $esx
    foreach($service in $services){
        $esxcli.network.firewall.ruleset.allowedip.remove($remoteIP1,$service)
$esxcli.network.firewall.ruleset.allowedip.remove($remoteIP2,$service)
        }
    }
foreach($esx in Get-VMHost){
    $esxcli = Get-EsxCli -VMHost $esx
    foreach($service in $services){
        $esxcli.network.firewall.ruleset.set($true,$true,$service)
        }
    }

This scripts audits for these two services to sohow if they allow all IPs and reports any deviation:

$Services = "webAccess","sshServer"
foreach($esx in Get-VMHost){
    $esxcli = Get-EsxCli -VMHost $esx
$esx       
$esxcli.network.firewall.ruleset.allowedip.list('sshServer')
        $esxcli.network.firewall.ruleset.allowedip.list('webAccess')
    }

That should give you the name of the host that still lists IPs and doesn't list {All}:

Name                 ConnectionState PowerState NumCpu CpuUsageMhz CpuTotalMhz   MemoryUsageGB   MemoryTotalGB Version
----                 --------------- ---------- ------ ----------- -----------   -------------   ------------- -------
labesx01            ... Connected       PoweredOn      32         291       95760          12.188         255.654   6.7.0

AllowedIPAddresses : {All}
Ruleset            : sshServer


AllowedIPAddresses : {All}
Ruleset            : webAccess

Monday, 3 February 2020

vRealize Operations - %CSTP View

vRealize Operations - %CSTP View


I was asked to check a cluster to ensure the %CSTP value was looking ok. I didn't fancy logging in with putty onto 40 ESXi Hosts and wondered about an easier way. We had an older version of vRealize Operations Manager in play but I could see any articles on Google about creating a custom report or view specifically for this value. It had been a few months since I played with this product so this post is a refresher for myself in case I need to do this anywhere else in the future! It also might be useful for someone else at some point!

Prior to version 7.5 I wasn't really a fan. Since then they've really improved the built in views and reports and made it a much better product. That said, coming back to it after a period of time requires patience to figure out where everything is. The key thing we need is a view that selects a host and grabs the %CSTP value. Then we can use this is a dashboard or report for multiple hosts.

I'm using the Hands On Labs below - any of the "What's new in vROPS" will work fine for you if you want to try this. There are only two hosts and limited historical data due to the frozen nature of the lab itself but it should allow you to see some information before you try it in Production!

Start by selecting Dashboards and Views from the left
Select a New View and give it a name

 We want a trend as we want to see more than a single average value. Note: Increase the maximum plot lines to more than the potential number of hosts you may want to run this against. 25 is the default. I updated mine to 50 just in case.

Subjects is going to be found under the vCenter Adapter

Find and select Host System in the list

Under Data, select CPU and Select Co-Stop (ms)

Drag it over to the right hand side

DeSelect the Trend of the historical data and Forecast options. I'm just investigating specific incidents in the past

Select time settings and choose the period of time you want to show - 7 days is the default

Click Save

You now have your new view. 

I have a specific cluster I need to keep an eye on so a Dashboard with a fixed target would make life easier than having to keep selecting the same cluster all the time. 

Under Actions, choose Create Dashboard
Toggle the button down the bottom right to select "Views" and drag the Trend View into the main dashboard

Click on the pencil icon on the top right of the widget view to edit it. Change Self Provider to On and select the Cluster you want to report on. Select the %CSTP View on the right and Click Save. 

Now you will see each host in the cluster and the %CSTP value over the last week with a different colour for each Host. You can hover over the graph to pick out any host that is experiencing high %CSTP to identify it. 


The same view can also be used in a report that can be exported to PDF or CSV as follows:

Go to the Report View
Create a New Report

Select the View you created earlier and drag it over to the right

Accept all the remaining defaults


When you execute the report you can choose where to focus it. Sect vSphere Host and Clusters to be shown the Datacenter views so you can choose a specific cluster or host. 

You will get a PDF report like this:

If you have a lot of hosts it will make the legend disappear off page. I would scope the report more carefully than the dashboard which is more interactive. 

That's it! Hope this helps someone else out there! 


Thursday, 30 January 2020

Auditing Complex vSphere Network Environments

Auditing Complex vSphere Network Environments


Sometimes customers specify a particular network configuration they want to use in their environment. Despite warnings that complexity comes at a cost they proceed. I'm usually the one who bears the brunt in two ways. One, I have to build the environment and match up hundreds of vmnics with the correct uplinks and Two, If I get any wrong I've to troubleshoot and fix it!

The simplest way to set up HPE Blades is to NOT use loads of FlexNics to control bandwidth etc. We do use CNAs or Converged Network Adapters to carry Ethernet and Storage traffic and this is ok as we'll split maybe 8Gb to Storage and 12Gb to Ethernet but that's it. We present two HBAs and two "20Gb" Nics to the Blade. We connect the Ethernet NICs to a single DVS and use Netioc to prioritize management, vm and vmotion traffic accordingly. It's simple and works every time.

Now, take a customer who prefers to carve up the 20Gb NIC into multiple Ethernet sub nics called FlexNics in HPE's world. We've taken 8Gb for storage firstly, and then they want say 2Gb for Backup, 2.5GB for vMotion and the rest for Management. You are now presenting SIX nics per host instead of two. You will still use a Single DVS but it has to have six uplinks. You should rename those uplinks so that it clearly states what each is to be used for. Now when you join a host to the DVS you MUST assign each pair of vmnics to the CORRECT uplink. Yeah, it's fun! 

Problem: In about 1 blade in 20 in my experience, the PCI order is reversed and you will experience wierd symptoms such as:

  • Can ping blade but can't open SSH to it despite no lockdown mode and ssh service is running
  • Can't vmotion off or to this host despite vlan and ip being correct
That was some of the wierdness when I rang VMware about an issue and we found a mismatch between the vmnics and uplinks. So, I spent a while trying to see how I would audit this. Is there a script I could use to extract information from HPE OneView and vSphere that would let me see if I had an issue with a host in this way? It's not good enough to just dump the MAC addresses from each side, we need the vmnic number and the uplink name also to do a proper comparison. 

So, I'm assuming here you have an environment that is not connected to the internet. It's easier if you do. Otherwise there is a bit of work to get powershell prepared so that it can execute vmware and HPE OneView commands correctly. You can just download the PowerCLI installer if that's easier, although it is getting out of date. Otherwise google how to install the VMware modules on an offline computer. You can transfer the install from one computer to another that way. 

HPE OneView can be installed locally and the modules transferred to the desired computer. You may decide to deploy a dedicated VM for this alongside the customer's environment. I had trouble installing .Net 4.7.2 on an existing host and didn't want to mess with it for too long. A fresh system might work best. More info on OneView POSH here: 

Now do this in powershell on an internet connected computer:
Install-Module HPOneView.500 or Save-Module HPOneView.500
Grab the folder "C:\Program Files\WindowsPowerShell\Modules\HPOneView.500" and copy this to the target along with the .Net 4.7.2 offline installer. Once there install .Net 4.7.2 and import the module into powershell (reboot as required):
Import-Module HPOneView.500
Verify the various versions and dependencies which will change and are captured in the github article above. 
Once you load the module you run these two commands to get the info we need from the HPE side:

connect-hpovmgmt -authlogindomain local -hostname 192.168.0.10 -username administrator -password hahahaha

get-hpovserverprofileconnectionlist | out-file -filepath .\connections.txt

(use the windows onscreen keyboard if connecting via a vmware console to get | and \ characters)
You may need to import any root / intermediate certificates to connect if you have replaced the self signed one from HPE. 

Now use powershell or powercli to run two scripts against the desired vCenter:

getmac.ps1:

get-vmhostnetworkadapter | select vmhost, name, IP, SubnetMask, Mac, PortGroupName, vMotionEnabled, mtu, FullDuplex, BitRatePerSec | Export-csv c:\temp\vmhostnetworkdetails.txt

report.ps1:

$report = @()

foreach($sw in (Get-VirtualSwitch -Distributed)){

    $uuid = $sw.ExtensionData.Summary.Uuid

    $sw.ExtensionData.Config.Host | %{

        $portStates = $sw.ExtensionData.FetchDVPorts($null)

        $esx = Get-View $_.Config.Host

        $netSys = Get-View $esx.ConfigManager.NetworkSystem

        $netSys.NetworkConfig.ProxySwitch | where {$_.Uuid -eq $uuid} | %{

            foreach($pnicSpec in $_.Spec.Backing.PnicSpec){

                $row = "" | Select Host,dvSwitch,PNic,PortLinkUp,DvUplink,confvlans,SpeedLink,DuplexLink

                $row.Host = $esx.Name

                $row.dvSwitch = $sw.Name

                $row.PNic = $pnicSPec.PnicDevice

                $row.PortLinkUp = ($portStates | where{$_.Key -eq $pnicSPec.UplinkPortKey}).State.RunTimeInfo.LinkUp

                $row.DvUplink =  ($portStates | where{$_.Key -eq $pnicSPec.UplinkPortKey}).config.Name

                $row.confvlans = (($portStates | where{$_.Key -eq $pnicSPec.UplinkPortKey}).State.RuntimeInfo.vlanids | ft -HideTableHeaders |out-string).TrimStart().TrimEnd()

                $row.SpeedLink = ($netSys.NetworkConfig.pnic | where {$_.Device -eq $pnicSPec.PnicDevice }).Spec.Linkspeed.SpeedMb

                $row.DuplexLink = ($netSys.NetworkConfig.pnic | where {$_.Device -eq $pnicSPec.PnicDevice }).Spec.Linkspeed.Duplex

                $report += $row

            }

        }

    }

}

$report | Export-Csv -Path .\report.csv -NoTypeInformation -UseCulture

(Credit & Thanks again to LucD for the script above)

Now take the 3 files and open Excel!

Import the connections.txt and vmhostnetworkdetails.txt and finally report.csv files into a single excel file. Move them around until they are in adjacent workbooks. You will need to use the "Text to Columns" option under the Data ribbon to convert and then format the data correctly, using Fixed Width for connections.txt data and comma separation for vmhostnetworkdetails. The report data is fine. Choose Format, AutoFit Column Width under the Home ribbon. 
Remove any spurious top lines from the worksheets so you're just left with the headings and the data. 

Next, on the Report worksheet, remove the rows which we're not interested in. I have additional Mezzanine ethernet adapters connected to Lag groups which I'm not interested in as these have no permutations to validate, they are straight connections between the vmnic and DVS uplinks groupings. Now we're left with 6 lines per host. 

We need to move some stuff around as vlookups work best when the "KEY" we're going to generate is referenced. Go to the connections worksheet and move or copy the mac column so it's the FIRST column in that worksheet. 

Now we create a key in one of the sheets. Go to the vmhostnetworkdetails worksheet and create a new Column A in front of everything else. For the first host line on row 2 enter the formula "=B2&C2" so that it concatenates the values of the VM Host and Name into a single value we'll use to reference against. Copy and Paste that formula right down Column A where ever there's data in the corresponding Rows. 
Now go to the Report worksheet and delete the D/F/G/H columns which we don't need. In an empty column to the right of the data we'll repeat the previous step. So in my case in J2 I've the formula "=A2&C2". Copy and Paste this as before all down Column J where there's data to the left. 

Now we start pulling data in from the other two worksheets. 
In the Report Worksheet enter the following formula into F2 and copy down the spreadsheet in Column F:
"=VLOOKUP(J2,vmhostnetworkdetails!A:F,6,FALSE)"
That should populate all the MACs that Vmware reported on
In the Report Worksheet enter the following formula into G2 and copy down the spreadsheet in Column G as before:
"=VLOOKUP(F2,'connections'!A:G,7,FALSE)"
Now we need a way to see if we've aligned the OneView Connection with the right DVS Uplink. Here's how we do that. 

There are three pairs of repeating uplinks per host left in the report worksheet. My uplink naming is as follows:
  • Management-1
  • Management-2
  • Backup-1
  • Backup-2
  • vMotion-1
  • vMotion-2
I created a formula in Column K to say Correct or Wrong depending if I've a mismatch or not. There is a set of 6 repeating formulas as follows:

K2: "=IF((AND(D2="Management-1", G2="A-Net_Set")), "Correct", "Wrong")"
K3: "=IF((AND(D3="Management-2", G3="B-Net_Set")), "Correct", "Wrong")"
K4: "=IF((AND(D4="Backup-1", G4="A-Backup")), "Correct", "Wrong")"
K5: "=IF((AND(D5="Backup-2", G5="B-Backup")), "Correct", "Wrong")"
K6: "=IF((AND(D6="vMotion-1", G6="A-Vmware_vMotion")), "Correct", "Wrong")"
K7: "=IF((AND(D7="vMotion-2", G7="B-Vmware_vMotion")), "Correct", "Wrong")"

Once you get these 6 entered, you can copy the set of 6 and paste a few times. Then copy several sets of six and you'll be able to quickly paste right the way down column K until all hosts have this field populated. 
Next Select Column K and do conditional formatting to highlight any field where the text ="Wrong" in RED and scroll down the report to see if you have a problem or not with any hosts. Done!!

If all this seems confusing grab my sample spreadsheet here:

You can then replace the data with your own and expand the formulas right down as far as you need to go based on the 1 host example I've shown. 

Hope this helps. Bit of a pain at first but at least you can be assured that all your vmnics and uplinks are lined up correctly when deploying 100's of hosts!!