Thursday 22 October 2015

Installing HP Cloudsystem 9.0 - Part 7

Installing HP Cloudsystem 9.0 - Part 7

This post deals with registering vCenter and activate a compute cluster so you can deploy instances and play with Openstack. 

So, browse to the Operations Console Integrated Tools section

http://192.168.10.80/#/system/integrated_tools

Enter your vCenter details and Click Register

You will see this when completed

Clicking on the entry gives the following information and also allows you to update settings later should a password change etc

Now Click on the Compute Menu section and Compute Nodes. You will see your Clusters there and I'm ready to activate my Compute Cluster which has an Intel NUC in it built for this purpose. I did reset the networking as it was previously attached to my main Distributed vSwitch, I created a second DVS and it is now joined here. See the Admin guide on Page 123 onwards for guidance.

Go to vCenter and Manage each Compute host, go to the Configuration and edit the Security Profile / Firewall / inbound configuration to enable "VM serial port connected over network".

There is also an option of enabling console access from the Openstack console via VNC on ports 5900-6105 but it's a wide range and you probably won't give users access to the Openstack Console?

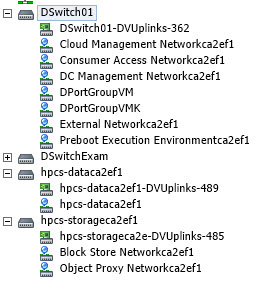
The screenshot above shows how my DVS configuration is looking currently. The Management Host uses DSwitch01 and the Compute Host DSwitch02. Now, I'm really excited about getting VM segmentation without having to use NSX so here is where we exploit the Open vSwitch vApp!

Go to the folder you extracted the CloudSystem 9.0 Tools to and you will see an OVF called "cs-ovsvapp.ova". Upload this to vCenter as follows:

So, when we activate the compute cluster this OVSvApp is automatically installed on each ESXi Host.

Note: I ran into a problem locating the OVSvApp on my Management cluster, it's just a cloning problem but to resolve I rebooted my vCenter to clear the Clone and deleted the Template, reimporting the OVF directly to my Compute Cluster.

Let's see if this is true.

I've selected the Cloud Cluster where my Intel NUC Compute Node is and you get an option to Activate. Double Check your networking and the relevent section in the Admin Guide and off we go!

You can specify vnmic interfaces here and have CS9 create the DVS or as I have do it yourself and tell CS9 where to go. Click Queue for Activation and then you can Click Complete Activiations for when you're doing many at a time I guess.

Boy, they aren't taking any chances! Click Confirm Activations when ready. You will see the Cluster Activating


And you will also see if Cloning your OVSvApp!

After the Clone / relocate issue I encountered I was unable to successfully re-activate the Compute Cluster. I got errors as follows:

Beginning activation checks (Cloud(labvc.lab.local)),
Verifying that no whitespace or special characters exists in the cluster name or its datacenter name while activating cluster Cloud,
Checking if controller(s) are reachable while activating the cluster Cloud,
Verifying cluster has at least one host,
Verifying cluster has at least one shared datastore,
Verifying that the cluster is enabled with DRS,
Checking for instances on the compute Cloud(labvc.lab.local),
Error: OVSvApp installation failed:  (Exception),
Initializing OVSvApp installer configuration,
Running OVSvApp installation scripts

I also got:
Error: OVSvApp installation failed: Couldn't find the OVSvApp Template/Appliance (Exception),

I found one problem - when I dropped my compute host back to a standard vswitch and created a new DVS I forgot to check jumbo frames were enabled so my clone of the OVSvApp or anything else was getting stuck at 29%. Once that was fixed I rebooted vCenter and the Compute Host and tried again with the template attached and stored on the compute host:

Beginning activation checks (Cloud(labvc.lab.local)),
Verifying that no whitespace or special characters exists in the cluster name or its datacenter name while activating cluster Cloud,
Checking if controller(s) are reachable while activating the cluster Cloud,
Verifying cluster has at least one host,
Verifying cluster has at least one shared datastore,
Verifying that the cluster is enabled with DRS,
Checking for instances on the compute Cloud(labvc.lab.local),
Initializing OVSvApp installer configuration,
Running OVSvApp installation scripts,
Found an existing management DVS & DCM portgroup,OVSvApp has been created and configured successfully,Successfully created DVS,
Checking for VCN L2 agent status,
Deployed OVSvApp virtual machines. Status: [u' ovsvapp-compute.lab.local on the host compute.lab.local is up and running '],
Updating Host details for cluster Cloud,
Updating OVSvApp details in vCenter: labvc.lab.local,
Updating cluster details for nova.conf,
Waiting for the service to be detected by the Cloud controller,
Compute node: domain-c261(Cloud) successfully added in the list of hypervisors,
Ending Activation (Cloud(labvc.lab.local))

Phew!! I now have a slightly different network configuration, the OVSvApp has 4 NICs, 3 news ones on DSwitch02 but it also creates a new DVS with no physical uplinks?!

Now the NUC only has 2 x pCPU and the OVSvApp requires the following hardware:
I might try to edit the vCPU and reduce it to 2....Done and it appears to be ok...

The Activated Compute Nodes looks like this now in the Operations Console:

Tenant Networks are created in the Trunk DVS which then allows the OVSvApp to control who they can talk to and how. The 4 OVSvApp nics use the VMXNET3 driver which means no 1Gb E1000 bottlenecks! Lovely! Just check the Load Balancing Policy on these new Port Groups to ensure you're getting the best configuration in your environment.

I also just noticed on page 16-17 in the Troubleshooting guide they recommend removing two port groups when this happens (Failed first attempt at activation):

Manually remove the switches before retrying the compute activation action.
1. Using administrator credentials, log in to vCenter.
2. Select Inventory→Networking.
3. Right-click the Cloud-Data-Trunk-<cluster_name> distributed switch and select Remove.
4. Right-click the CS-OVS-Trunk-<cluster_name> distributed switch and select Remove.
5. Retry the activation action on the ESXi compute node.

That's all for now. I'll cover the command line tools in the next post but after that I'm stuck. I've been having difficulty deploying Windows images from Glance to ESXi. I had similar experiences using Openstack over a year ago but found ways around it. Back to the drawing board butwork is busy so it may be a while due to the labour intensiveness of booting the lab up and shutting it down, it's not a 5 minute quick check. If you find a solution post a comment!!!

Wednesday 14 October 2015

Installing HP Cloudsystem 9.0 - Part 6

Installing HP Cloudsystem 9.0 - Part 6


So, you need to allow about an hour to start up your Lab according to the Admin Guide instructions starting on page 55.

Management Appliances:

Start by powering on the Compute and Management Hosts and then the OVSVAPP VM on the Compute Host.

Next continue by powering on the ma1 appliance, in my lab it's called cs-mgmt1. If you look at the console it will stay on a screen listing network adapters etc for a few minutes, wait until this clears to a logon screen then SSH on and prep the VM as follows:

sudo -i
service mysql bootstrap-pxc
service mysql status

Power on ma2 / cs-mgmt2
Wait for the logon prompt on the console and check mysql on ma2 from ma1:
ssh cloudadmin@ma2 sudo service mysql status

Power on ma3 / cs-mgmt3
Wait for the logon prompt on the console and check mysql on ma3 from ma1:
ssh cloudadmin@ma3 sudo service mysql status

perform the following on each of the VMs in turn starting with ma1, then ma2, finally ma3:
os-refresh-config
This spins through hundreds of pages of checks, takes 2-3 minutes and ends with this:

Wait until each is completed before doing the next appliance:
os-refresh-config
ssh cloudadmin@ma2 sudo os-refresh-config
ssh cloudadmin@ma3 sudo os-refresh-config

The Healthcheck involves logging into the Management Portal, I use the VIP link as follows:
http://192.168.10.80
Then go to General, Monitoring & Launch Monitoring Dashboard
(I get the odd error "Unable to list alarms - connection aborted, etc....)
This didn't show any useful information at this point
The HA proxy shows all up in green except monasca:
http://192.168.10.80:1993

The Cloud Controllers are next:

Power on cmc or in my case cs-cloud1
Wait a few minutes for it to get to a logon prompt
Go back to the ma1 / cs-mgmt1 appliance and execute the following commands:
ssh cloudadmin@cmc sudo service mysql bootstrap-pxc
ssh cloudadmin@cmc sudo service mysql status

Power on cc1 & cc2 and wait for a logon prompt
(Hit enter as some messages may make it appear to be paused but it's actually ready)
from ma1 run the following commands on the cc1 & cc2 appliances:
ssh cloudadmin@cc1 sudo service mysql status
ssh cloudadmin@cc2 sudo service mysql status

Now perform an os-refresh-config on each appliance:
ssh cloudadmin@cmc sudo os-refresh-config
ssh cloudadmin@cc1 sudo os-refresh-config
ssh cloudadmin@cc2 sudo os-refresh-config
The os-refresh-config completes much faster than it did for the management appliances

Log into the Openstack Console
https://192.168.12.200/admin/info/
User: admin, <password as specified during install>
Check the Admin\System\System Information on the left and inspect each of the sections: Services, Compute Services, Block Storage Services and Network Agents to ensure all are Enabled and operating
The Cloud Controller HA Proxy should also be checked:
http://192.168.10.81:1993

Now for the Enterprise Appliances:

Power on ea1 / cs-enterprise1
Wait for a logon prompt (and yes, it DOES reference a cattleprod!!!)

ssh cloudadmin@ea1
sudo -i
service mysql bootstrap-pxc
service mysql status
sudo -u csauser /usr/local/hp/csa/scripts/elasticsearch start
sudo -u csauser /usr/local/hp/csa/scripts/msvc start
service csa restart
service mpp restart
service HPOOCentral restart
exit
exit

Power on ea2 / cs-enterprise2 & wait for the cattleprod / logon prompt
Power on ea3 / cs-enterprise3 & wait for the cattleprod / logon prompt

ssh cloudadmin@ea2
sudo -i
service mysql status
sudo -u csauser /usr/local/hp/csa/scripts/elasticsearch start
sudo -u csauser /usr/local/hp/csa/scripts/msvc start
service csa restart
service mpp restart
service HPOOCentral restart
exit
exit

ssh cloudadmin@ea3
sudo -i
service mysql status
sudo -u csauser /usr/local/hp/csa/scripts/elasticsearch start
sudo -u csauser /usr/local/hp/csa/scripts/msvc start
service csa restart
service mpp restart
service HPOOCentral restart
exit
exit

At this stage there is no useful information in the Openstack user dashboard or the Operations Console. The HA Proxy appears to be best at this stage:
http://192.168.10.82:1993/

In one scenario my ea2 showed CSA errors above so I ran through the steps above again on that appliance which resolved them and all turned green!

The Co-Stop only blipped to 2/4/6 Milliseconds a few times over this process so I'm happy this is less stressful on the environment!

You can check the Enterprise interfaces such as Marketplace, CSA & OO if you wish here.

Next are the monitoring appliances:

Power on mona1 / cs-monitor1 and wait for the cattleprod / logon screen

Now, I had trouble in one instance shutting down these appliances so on power up I saw a LOT of messages and thought it was shafted. I've since noticed that even after a clean power down it's not happy! You typically notice mona1 cycling through "monasca-notification main process ended messages" a LOT. You may spot a logon prompt on the others hidden around the messages. There is a fix below but run through the mysql steps below first anyway as SSH does work despite the warnings.

On the ma1 appliance connect to mona1:

ssh cloudadmin@mona1
sudo -i
service mysql bootstrap-pxc
service mysql status
exit
exit

Power on mona2 / cs-monitor2 & wait for a logon prompt
Power on mona3 / cs-monitor3 & wait for a logon prompt
ssh cloudadmin@mona2 sudo service mysql status
ssh cloudadmin@mona3 sudo service mysql status


Start the Update Appliance:

Power on ua1 / cs-update1
from the ma1 appliance ssh to it
ssh cloudadmin@ua1 sudo os-refresh-config

That's it - you should be getting health information on the Operations Console & Openstack Console.

Monitor Appliances Fix:

My 3 monitoring appliances are constantly cycling through a pair of errors:

monasca-api main process ended, respawning
monasca-monitoring main process ended, respawning

I've tried power cycling, and bringing up either the first or third one on it's own to no avail. I got pointed by more knowledgeable colleagues to the Admin guide pages 61 & 62 - "Unexpected Shutdown recovery options".

So, even though the console is going Nuts (!) you can still SSH onto these appliances and see what's wrong.

ssh cloudadmin@mona1
sudo -i
cat /mnt/state/var/lib/mysql/grastate.dat
Check the seqno for it's value, mine on all 3 appliances were -1 but I ran the following command on mona1 anyway:
service mysql bootstrap-pxc
service mysql status
then I exited twice and ssh'd into each of the other 2 appliances and ran:
service mysql restart
service mysql status
I then restarted the 3 appliances, one at a time:
ssh cloudadmin@mona1 sudo shutdown -r now
ssh cloudadmin@mona2 sudo shutdown -r now
ssh cloudadmin@mona3 sudo shutdown -r now

So far, no difference, it was the next set of commands that fixed this for me.
ssh cloudadmin@mona1
sudo -s
export PYTHONPATH=/opt/vertica/oss/python/lib/python2.7/site-packages
su dbadmin -c 'python /opt/vertica/bin/admintools -t view_cluster -d mon';
This command firstly showed the following while mona3 was restarting:

 DB  | Host         | State
-----+--------------+--------------
 mon | 192.168.0.33 | INITIALIZING
 mon | 192.168.0.34 | INITIALIZING
 mon | 192.168.0.35 | DOWN

Then it changed to this a few moments later:

 DB  | Host | State
-----+------+-------
 mon | ALL  | DOWN

As all 3 nodes were down we need to restart Vertica from a last good known state. We copy out the vertica_admin_password="XXXXX" from /home/cloudadmin/hosts
vi /home/cloudadmin/hosts
You can just copy everything out of SSH if you're using PUTTY and paste it into Notepad and extract the exact password. Then run the following command:
su dbadmin -c 'python /opt/vertica/bin/admintools -t restart_db -d mon -e last -p
<vertica_admin_password>';
This should do the trick or there is a further command to force the issue:
su dbadmin -c 'python /opt/vertica/bin/admintools -t restart_node -s 192.168.0.33,192.168.0.34,192.168.0.35 -d
mon -p <vertica_admin_password> -F'

Hopefully you can repeat the view_cluster command used earlier to confirm the status as follows:
-----+------+-------
 mon | ALL  | UP

All good!

Monday 5 October 2015

Installing HP Cloudsystem 9.0 - Part 5

Installing HP Cloudsystem 9.0 - Part 5


The interfaces for CS9, and there are plenty of them are all highly available except for the Update Appliance so your placement and anti-alias rules in a 3 node management cluster is very important.

This is a Lab, so I'm running all mine on a single Host while the Electricity Provider Van drives around the estate trying to figure out who's causing the brownout, I'm running a Cloud Lab buddy! I'm currently drawing 141.76 watts though in case you're interested!

So, to the interfaces:

You get directed to http://192.168.10.50 which is fine except it's not the VIP for the Management Appliance, I've can access the same interface using http://192.168.10.80

Username: Admin (capital "A") and password set earlier, I don't remember your password, that's your job! 
Well, that's different! At least everything is green! The Activity, Logging and Monitoring Dashboards require additional Authentication. If prompted use user "admin"/<password set during install> for these Dashboards. 

There's a Backup & Restore Tab! 

Integrated Tools is where we'll add our vCenter in and activate the Compute Cluster Node. 

So, this is the main Console that equates to the 8.1 HP Horizon Foundation Console. With OO moved to the Enterprise Appliance with CSA, and Openstack residing on it's own Appliances, these Appliances are devoid of Openstack/OO components from what I can tell. Monasca/Kibana URLs point to the Management Appliance so it's involved in exposing the monitoring elements from what I can tell. 

Let's move on to the Openstack Portals:
This is the Classic Openstack Horizon Portal from Juno: 
https://192.168.12.200
(user: admin, password as per install)

And the interface reflects this update:

Now there is still the HP equivalent but it leads to a monitoring page:
http://192.168.10.80:9090
The logon page looks the same as the previous one but we see this after logging in:

Then if you click on the Dashboard button under Monitoring you'll be brought to Monasca which monitors the environment:

The interfaces so far are for Administrator use. We certainly don't want to show them to a customer, that's what CSA is for! A nice friendly Marketplace with the HP OO engine powering the requests sent to Openstack, the Cloud, VMware direct to anywhere you want really! I've heard it can even order Pizza! 

The interface in my Lab is accessed via the following URL:
https://192.168.12.201:8444/csa

Username: Admin
Password: cloud

This will need to be changed later of course....This is CSA 4.5 so there are improvements and changes - you can now search the properties of your subscriptions, I'll test this later. 


The default Consumer Portal is available with nothing published to it:
https://192.168.12.201:8089/org/CSA_CONSUMER

The following credentials are used:
Username: consumer
Password: cloud


Shop away! 

Now the Operations Orchestration Console is accessed here:
http://192.168.10.82:9090/oo


The following credentials are used:
Username: administrator
Password: <password specified during setup>


This is where updated content can be imported from the HP Live Network:
and for CSA:

So that's the tour - I'll activate my Compute Node next and look at deploying a VM to see how that operates. 

Powering down your Lab

Lastly I'll see how to safely power down the Lab as the last thing I want to do is to have to rebuild it from scratch each time! See Page 54 on the HP Helion CloudSystem 9.0 Administrator Guide. 

SSH into ma1, the first Management Appliance created, in my case it's called cs-mgmt1 in vCenter and is on IP 192.168.10.50
We SSH into each appliance in order and shut them down one at a time:

Shutdown the Update Appliance (192.168.10.59):
ssh cloudadmin@ua1 sudo shutdown -h now
(Say yes to trust the ssl fingerprint and enter the password used during setup)

Shutdown the Compute Section of the Cloud:
Shutdown the VMs on the Compute ESXi Host(s) via vCenter
(This includes the OVSvAPP)
Shutdown the Compute ESXi Hosts themselves via vCenter

Shutdown the Monitoring Appliances (192.168.10.33/34/35):
ssh cloudadmin@mona3 sudo shutdown -h now
ssh cloudadmin@mona2 sudo shutdown -h now
ssh cloudadmin@mona1 sudo shutdown -h now
Note: The first one of these worked but the other 2 stalled the first time I did this. Be patient, they take a little longer to shutdown but all 3 worked for me the next time around. 

Shutdown the Enterprise Appliances (192.168.10.56/55/54):
ssh cloudadmin@ea3 sudo shutdown -h now
ssh cloudadmin@ea2 sudo shutdown -h now
ssh cloudadmin@ea1 sudo shutdown -h now

Shutdown the Cloud Controller appliances (192.168.10.53/52/51):
ssh cloudadmin@cc2 sudo shutdown -h now
ssh cloudadmin@cc1 sudo shutdown -h now
ssh cloudadmin@cmc sudo shutdown -h now

Shutdown the Management appliances (192.168.10.58/57/50):
ssh cloudadmin@ma3 sudo shutdown -h now
ssh cloudadmin@ma2 sudo shutdown -h now
ssh cloudadmin@ma1 sudo shutdown -h now

Startup is covered in the same guide on pages 55-57, yes it's That Long!! There's a lot of checking MYSQL status, I mean a LOT! Otherwise it doesn't look too complicated. 


Installing HP Cloudsystem 9.0 - Part 4

Installing HP Cloudsystem 9.0 - Part 4


Next step is to browse to the new Management Appliance via the IP Given, in my case http://192.168.10.50 and you get a First-Time Installer screen. It's a few pages long. I've filled it out as follows:

Edit the Data Center Management Network at this point:
Accept and continue on:

Now comes the biggie - the Password! This little change cost me a week. I know it's in the release notes but in 2015 you would think someone would accept special characters are good for passwords by now. Here is the password restrictions from Cloudsystem 8.1:

The password should have a capital letter and a number. You should have a minimum
of 8 characters, maximum of 40 characters. It must not contain any of the following
characters: less than (<), greater than (>), semicolon (;), comma (,), double-quotation
mark ("), apostrophe ('), ampersand (&), backslash (\), slash (/), vertical bar (|), plus
sign (+), colon (:), equal sign (=), and space.

Now from Cloudsystem 9.0:

Specify a password for admin that is eight characters or less and is a combination of uppercase
and lowercase letters and numerals. Symbols and special characters found on the keyboard
are not supported.

I guess someone forgot to tell the Developer that keyboards come with special characters for a very good reason, grammar and passwords! So, MAKE SURE you choose one that is compliant or you'll get to see 9 wonderful appliances deployed before it bombs out. If you tail the cs-avm-manager.log you'll see your invalid password in plain text appear alongside an error, just for good measure! It will fail, I've seen it, thrice! I used the same password in CS8.1 no problem and most of my other appliances etc in my Lab so this was unexpected and frustrating to say the least. 

If you try to use a small size for Glance you'll get an error:
At this stage I took the precaution of migrating all the cloud template files to my largest datastore as it doesn't ask you about destinations. The new VMs will appear in the same Datastore so during build this means you need a good bit of space (300GB+)!

The settings are summarized as follows:


Click Begin Installation and you can tail the cs-avm-manager.log if you're bored:
tail -f /var/log/cs-avm-manager/cs-avm-manager.log

The following Networks are created so it will end up something like this:

So far, so easy?! It took quite a while to get to the stage where all the appliances fully deployed. You should see the following if you were tailing the logfile above: 


The Initial Setup screen show now show all the deployment progress steps as completed in Green: 

If you get this far you're nearly there. If not here are a few places to look for answers:

Installation has failed. Please review the following log files for errors. Typically any fatal errors are near the end of the log files.

/var/log/cs-avm-manager/cs-avm-manager.log - this shows the overall deployment status.

/var/log/leia/leia-monitor.log - this shows the interaction between the UI and the components that do the deployment.

/var/log/upstart/os-collect-config.log - this shows the preliminary part of the deployment process.

/var/log/pavmms/pavmms_api.log - this shows the lower-level workings of the main part of the deployment process.

Final Steps (Page 25-26, HP Helion CloudSystem 9.0 Installation Guide):

Add a Physical NIC to the new Distributed vSwitches for Object and Block Storage

Wait for the Enterprise Appliances (Yes, all 3!) to finish updating by checking the following log:
cat /var/log/upstart/os-collect-config.log
for the line "CSL Installer Finished Importing additional Capsules"
(This can take another 30 minutes to finish)

SSH to ma1, in my case this is cs-mgmt1, you can check in the vCenter view (DNS Name)
SSH from within this appliance to ea1, which is cs-enterprise1 in my lab
ssh cloudadmin@192.168.10.54  (Yes to accept ECDSA key fingerprint)
sudo -i
vi /usr/local/hp/csa/jboss-as/standalone/deployments/csa.war/WEB-INF/classes/csa.properties
Replace (Nearly at the very bottom of the file): 
OOS_URL=https://192.168.12.201:9090
With:
OOS_URL=http://192.168.0.3:9090   (Make sure you change from https to http!)
service csa restart
exit
exit

Repeat for the other two Enterprise Appliances on 192.168.10.55 & 192.168.10.56

Check the HA Proxy Status page here:
http://192.168.10.82:1993/


We'll go through the various interfaces in the next Part of this series

I've captured the settings I entered on this section of the install process below in text format to help me if I should need to repeat this at a later date:

First-Time Installer Settings used:

Network Settings: Management Trunk

Datacenter Management Network
Primary DNS: 192.168.10.10
IP Ranges: 192.168.10.51-69

Consumer Access Network
vLAN ID: 51
CIDR: 192.168.12.0/24
Default Gateway 192.168.12.254
Appliance IP Ranges: 192.168.12.10-20

Cloud Management Network
vLAN ID: 50

External Network
vLAN ID: 52

Network Settings: Storage Trunk
Block Storage Network
vLAN ID: 60
Object Storage Network
vLAN ID: 61
CIDR: 192.168.19.0/24

Network Settings: Appliance Settings

Management Appliance
DCM FQDN: csmgmt.lab.local
DCM VIP: 192.168.10.80

Cloud Controller
DCM FQDN: cmc.lab.local
DCM VIP: 192.168.10.81
CAN FQDN: cmc.dept.lab.local
CAN VIP: 192.168.12.200

Enterprise Appliance
DCM FQDN: eap.lab.local
DCM VIP: 192.168.10.82
CAN FQDN: eap.dept.lab.local
CAN VIP: 192.168.12.201

Time Settings: 192.168.10.200

Password: Watch out, no special characters, in fact why use a keyboard at all?!!