HP Virtual Performance Viewer - installation & configuration
It's been a while since I looked at vPv, so now that a new version has been released (2.20) I thought I'd capture the install into my Lab below and go through some of the features you can check out. You can download the Product from here:http://www8.hp.com/us/en/software-solutions/vpv-server-virtualization-management/try-now.html
Once installed it goes into a community edition mode but you can switch to a 60 day premium edition to try out the more advanced features. The OVF is about 1.26GB so not too bad.
Go to the vSphere Web Client and deploy the OVF - right click the VM Folder you want to deploy to and click Deploy OVF Template
Browse to the location of the OVA file and Click Next
Click Next
Click Accept and Click Next
Enter a Name for the vPv VM and Click Next
Choose an appropriate configuration size, there are three choices, small above and medium and large below with different virtual hardware requirements
Select an ESXi Host and Click Next
Select a Datastore and Click Next
Select a Network and Click Next
Enter in the appliance network configuration appropriate to your environment, Click Next
Click Finish and the OVA will be deployed
The VM then powers on with the following hardware for a small deployment in my case
https://192.168.10.21:8444/PV/
(Change the IP / Hostname as appropriate)
Click Add Datasource and you can see there are a good few options, more than just VMware!
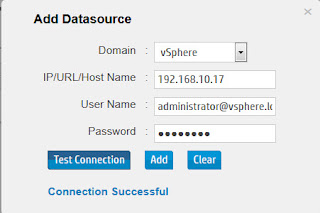
If you have all these environments you'll love this tool! I'll just add in my vCenter Server
Click Test Connection, than Add if successful. Note: I tried using administrator, lab\administrator, administrator@lab.local but it doesn't appear to like AD credentials, the Test Connection fails each time. The SSO logon is fine however.
You are currently using a community license but you can change this to get at more interesting features
Click Start Evaluation License
Click Ok
Check the license options, you're now running in Premium Mode (I don't think you can just test Express but you may as well try ALL the options in Premium!!). There are Server and OSI licensing models but speak to your HP account contact for pricing.
The trending and forecasting can take a few days to load sufficient data to start giving you accurate reports and trending.
There is also an agent you can install on the guest VMs to get more accurate information. You can then start to see the relationship between applications (Business View) was the Infrastructure View.
The monitoring agents for different operating systems are available
Copy the MSI or installer file to the VM and execute it, a windows install is given as an example here
Click Next
Click Next
Click Install
Wait for the install to finish
Click Finish
Now, I'm not sure about the next section - you can get Guest OS Drilldown for the vPv box but I've not got it working with two VMs as yet. The settings below may not work / be the right approach:
Now tell the monitor agent where the vPv server is - edit the hpcs.conf file in the path above with values similar to below - don't forget to take out the ";" at the start of the line!
[hpcs.hbp]
; Use the following line to push HBP events to a target hpcs acting as
; a registry.
http://192.168.10.21:8081/hbphandler=/lwiregistry/up
; HBP interval in seconds. Default value is 90.
interval=90
Update the contents with the IP Address of the vPv appliance and restart the service listed above.
Now I can tell you where you find the resulting Guest OS Drilldown as it took me a few minutes!
Capacity, Overview, and either View VMs by CPU Sizing or View VMs by Memory Sizing
Next Click the icon above across from the VM you want to examine, this is what I'm missing currently but the one for the vPv server should be available.
Enjoy the stats - click on a brown word to get more detailed stats!
You can also change the interval on the top right.
Next configure CSA integration
I used the following CSA URL:
You can apparently expose a tenants performance information with vPv so you could have a link in their marketplace that provides an add on value add service to give them insight into how their VMs are performing.
You can also integrate OneView to get an Infrastructure View
An Alert Message example is shown above
The Capacity View is shown above. There is a lot of good information to help right size.
Some Forecasting information is shown above.
Some Modelling information is shown above. I think I need to upgrade!
Some Heat Maps (Top: VMs - Compute, Middle: Data Stores, Bottom: VMs - Storage)
There is a Message Board that covers enhancements and FAQs worth checking out:
http://h30499.www3.hp.com/t5/forums/tagdetailpage/tag-cloud-grouping/message/tag-cloud-style/recent/message-scope/all/user-scope/all/tag-scope/single/tag-id/38871/timerange/all/tag-visibility-scope/public
There's plenty more to explore but that should be enough to whet your appetite for now! Worth a look?!


